

CapAid’s analysis
reveals the issues in Finnish
Working Capital Management
- And shows if your company is facing a threat!
Our analysis examines thousands of companies (€10M–€1B revenue) to uncover inefficiencies in working capital.
Through quartile benchmarking of key metrics – DSO, DPO, DIS, and NOWC – we highlight hidden risks and show how to fix them. Backed by leading industry research and EU/Finnish regulatory insight, we give you a clear view and a faster path to action.
Why Working Capital Insights Matter - Especially in Finland
DIS up by 6–7 days between 2020–2023 for manufacturers (PwC Finland, 2024)
DSO and DPO up by 1–2 days due to long payment cycles and delayed collections
Late payments have increased risk for SMEs, especially in the service sector
With rising costs and supply chain pressure, Finnish companies must manage working capital more tightly than ever.
Current Issues in Finland
Regulatory Context
FIN-FSA mandates financial health and liquidity risk awareness for larger firms
The EU Payment Directive recommends a maximum of 60-day payment terms in B2B, with interest penalties for late payments
Why This Matters:
Finnish businesses with poor cash flow management face higher borrowing costs and reduced agility
Small differences in DSO, DPO, or DIS can equate to millions of euros tied up unnecessarily
Top Quartile (Green): Excellent performance, minimal risk
Second Quartile (Yellow): Above-average, room for improvement
Third Quartile (Orange): Inefficiencies present, need attention
Bottom Quartile (Red): High risk, urgent need for action.
We’ve included over 5,000 Finnish companies across three sectors (Service, manufacturing, and Wholesale) using quartile benchmarking. This method divides companies into four categories:
CapAid’s Quartile-Based Analysis
Metrics We Analyze:
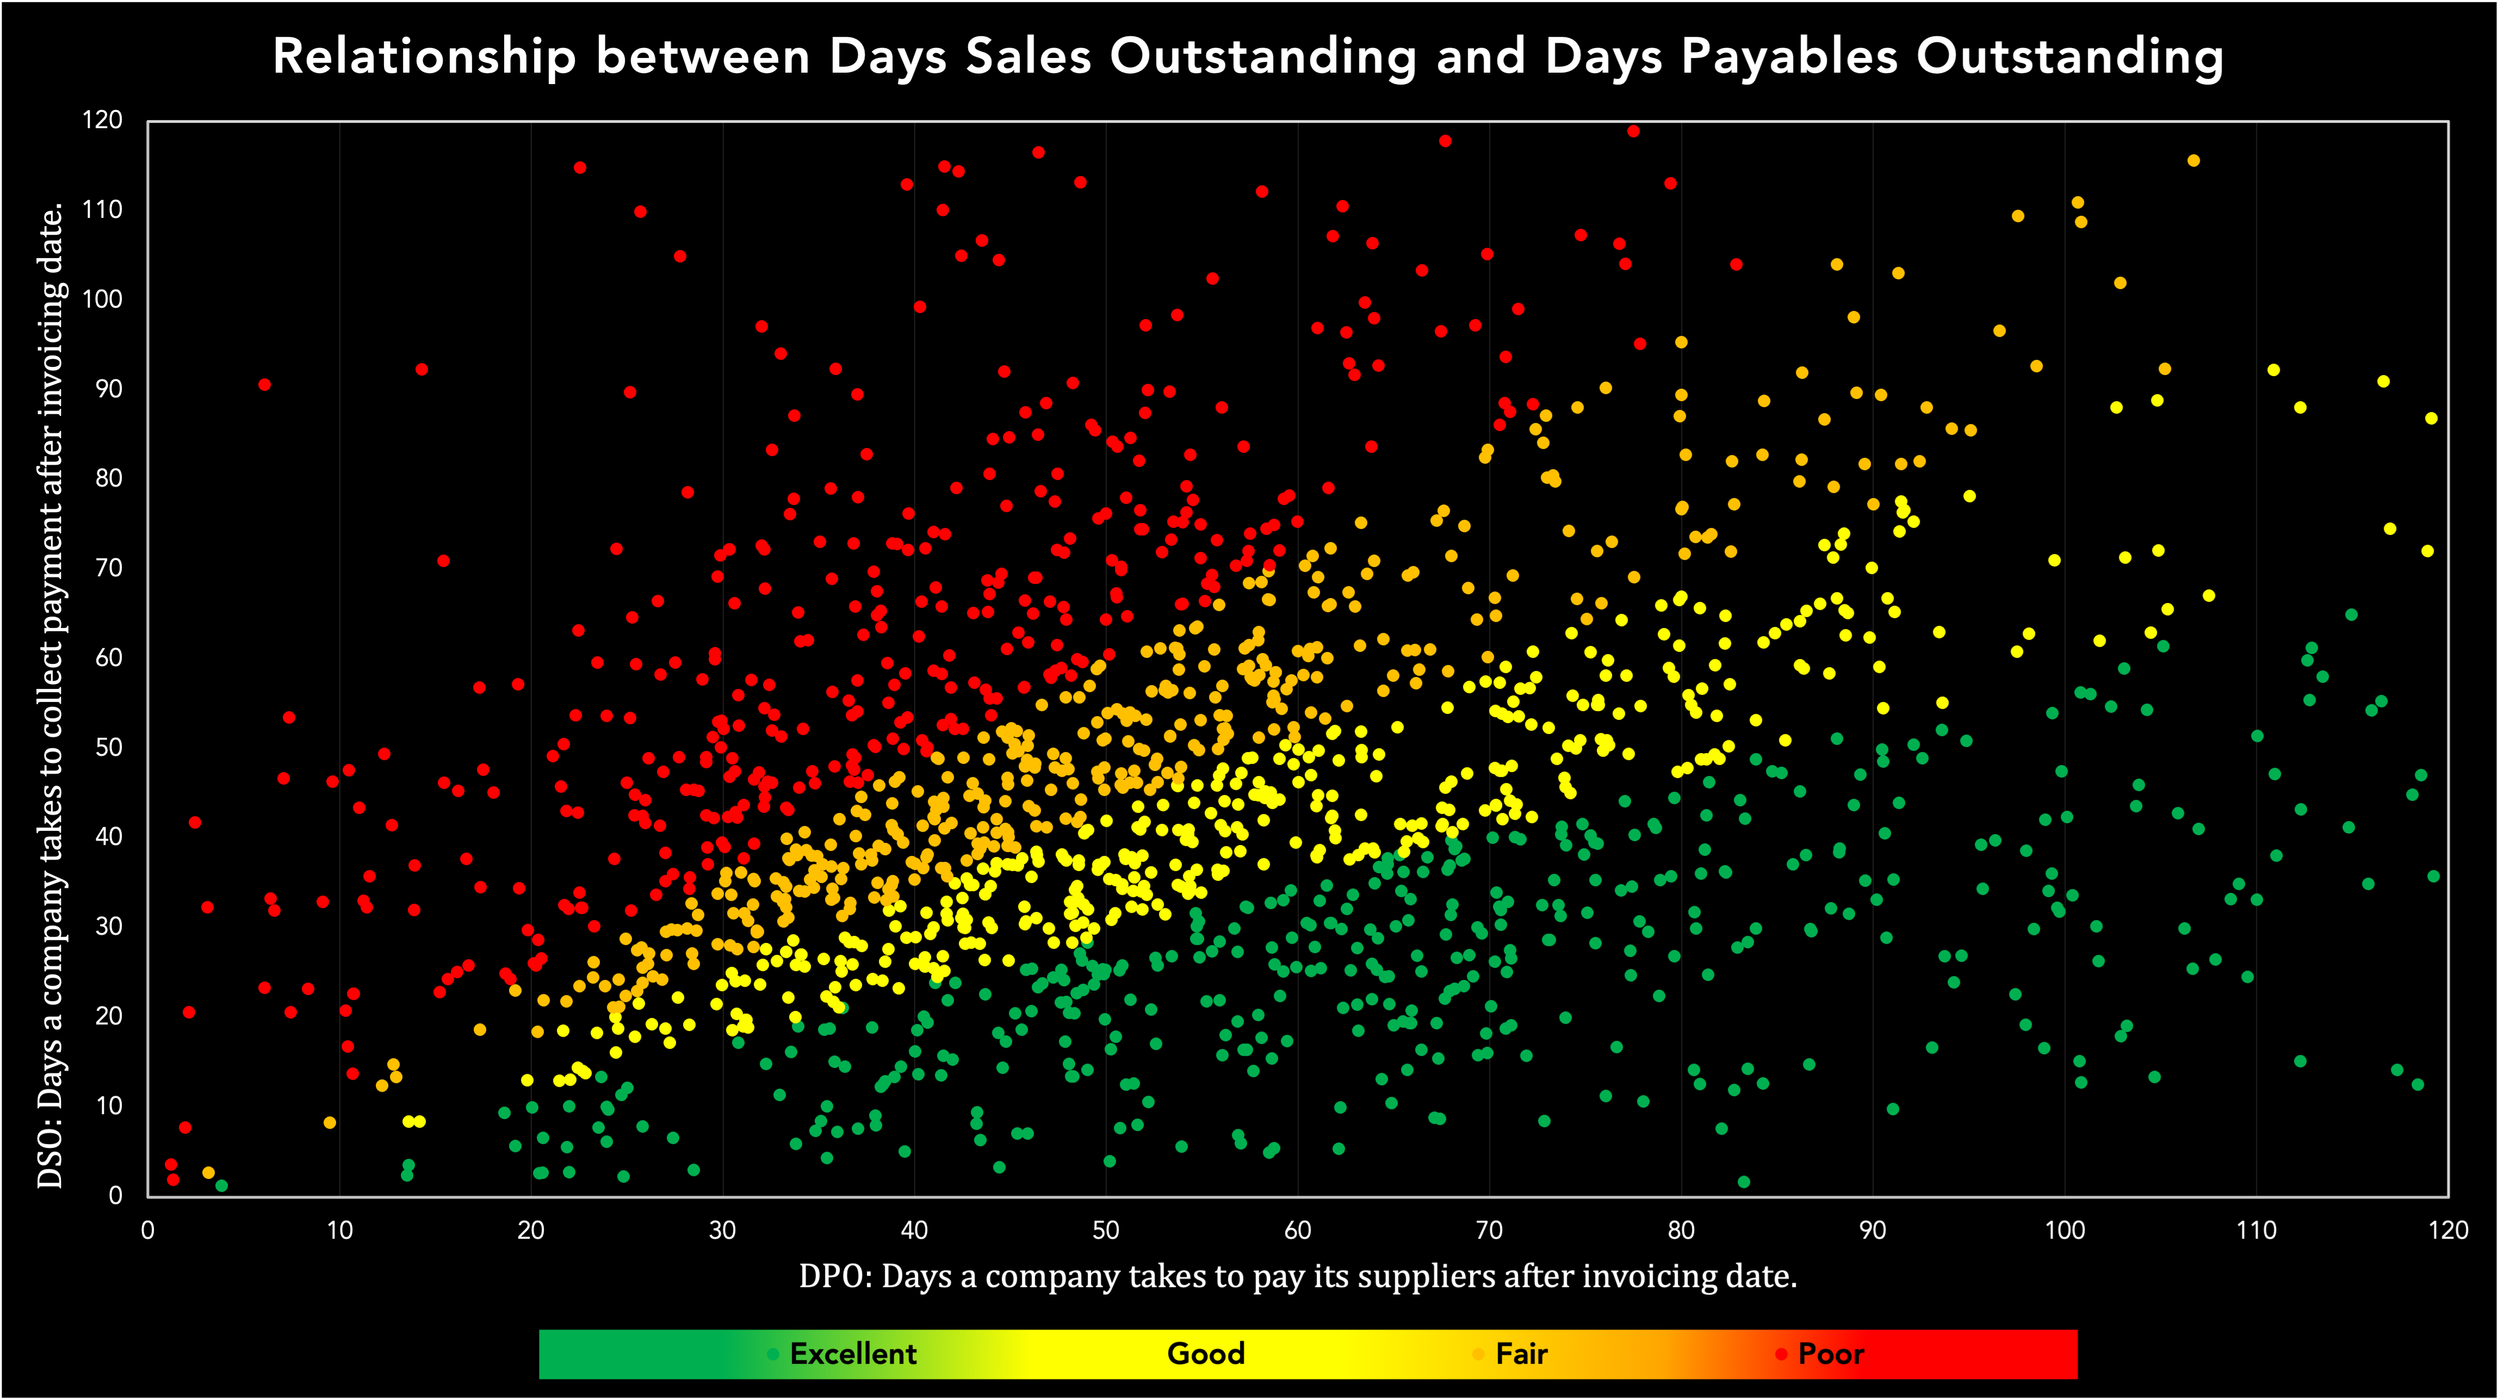
Days Sales Outstanding - DSO: How fast does the company collect payments?
Days Payable Outstanding - DPO: How fast does the company pay outgoing payments?
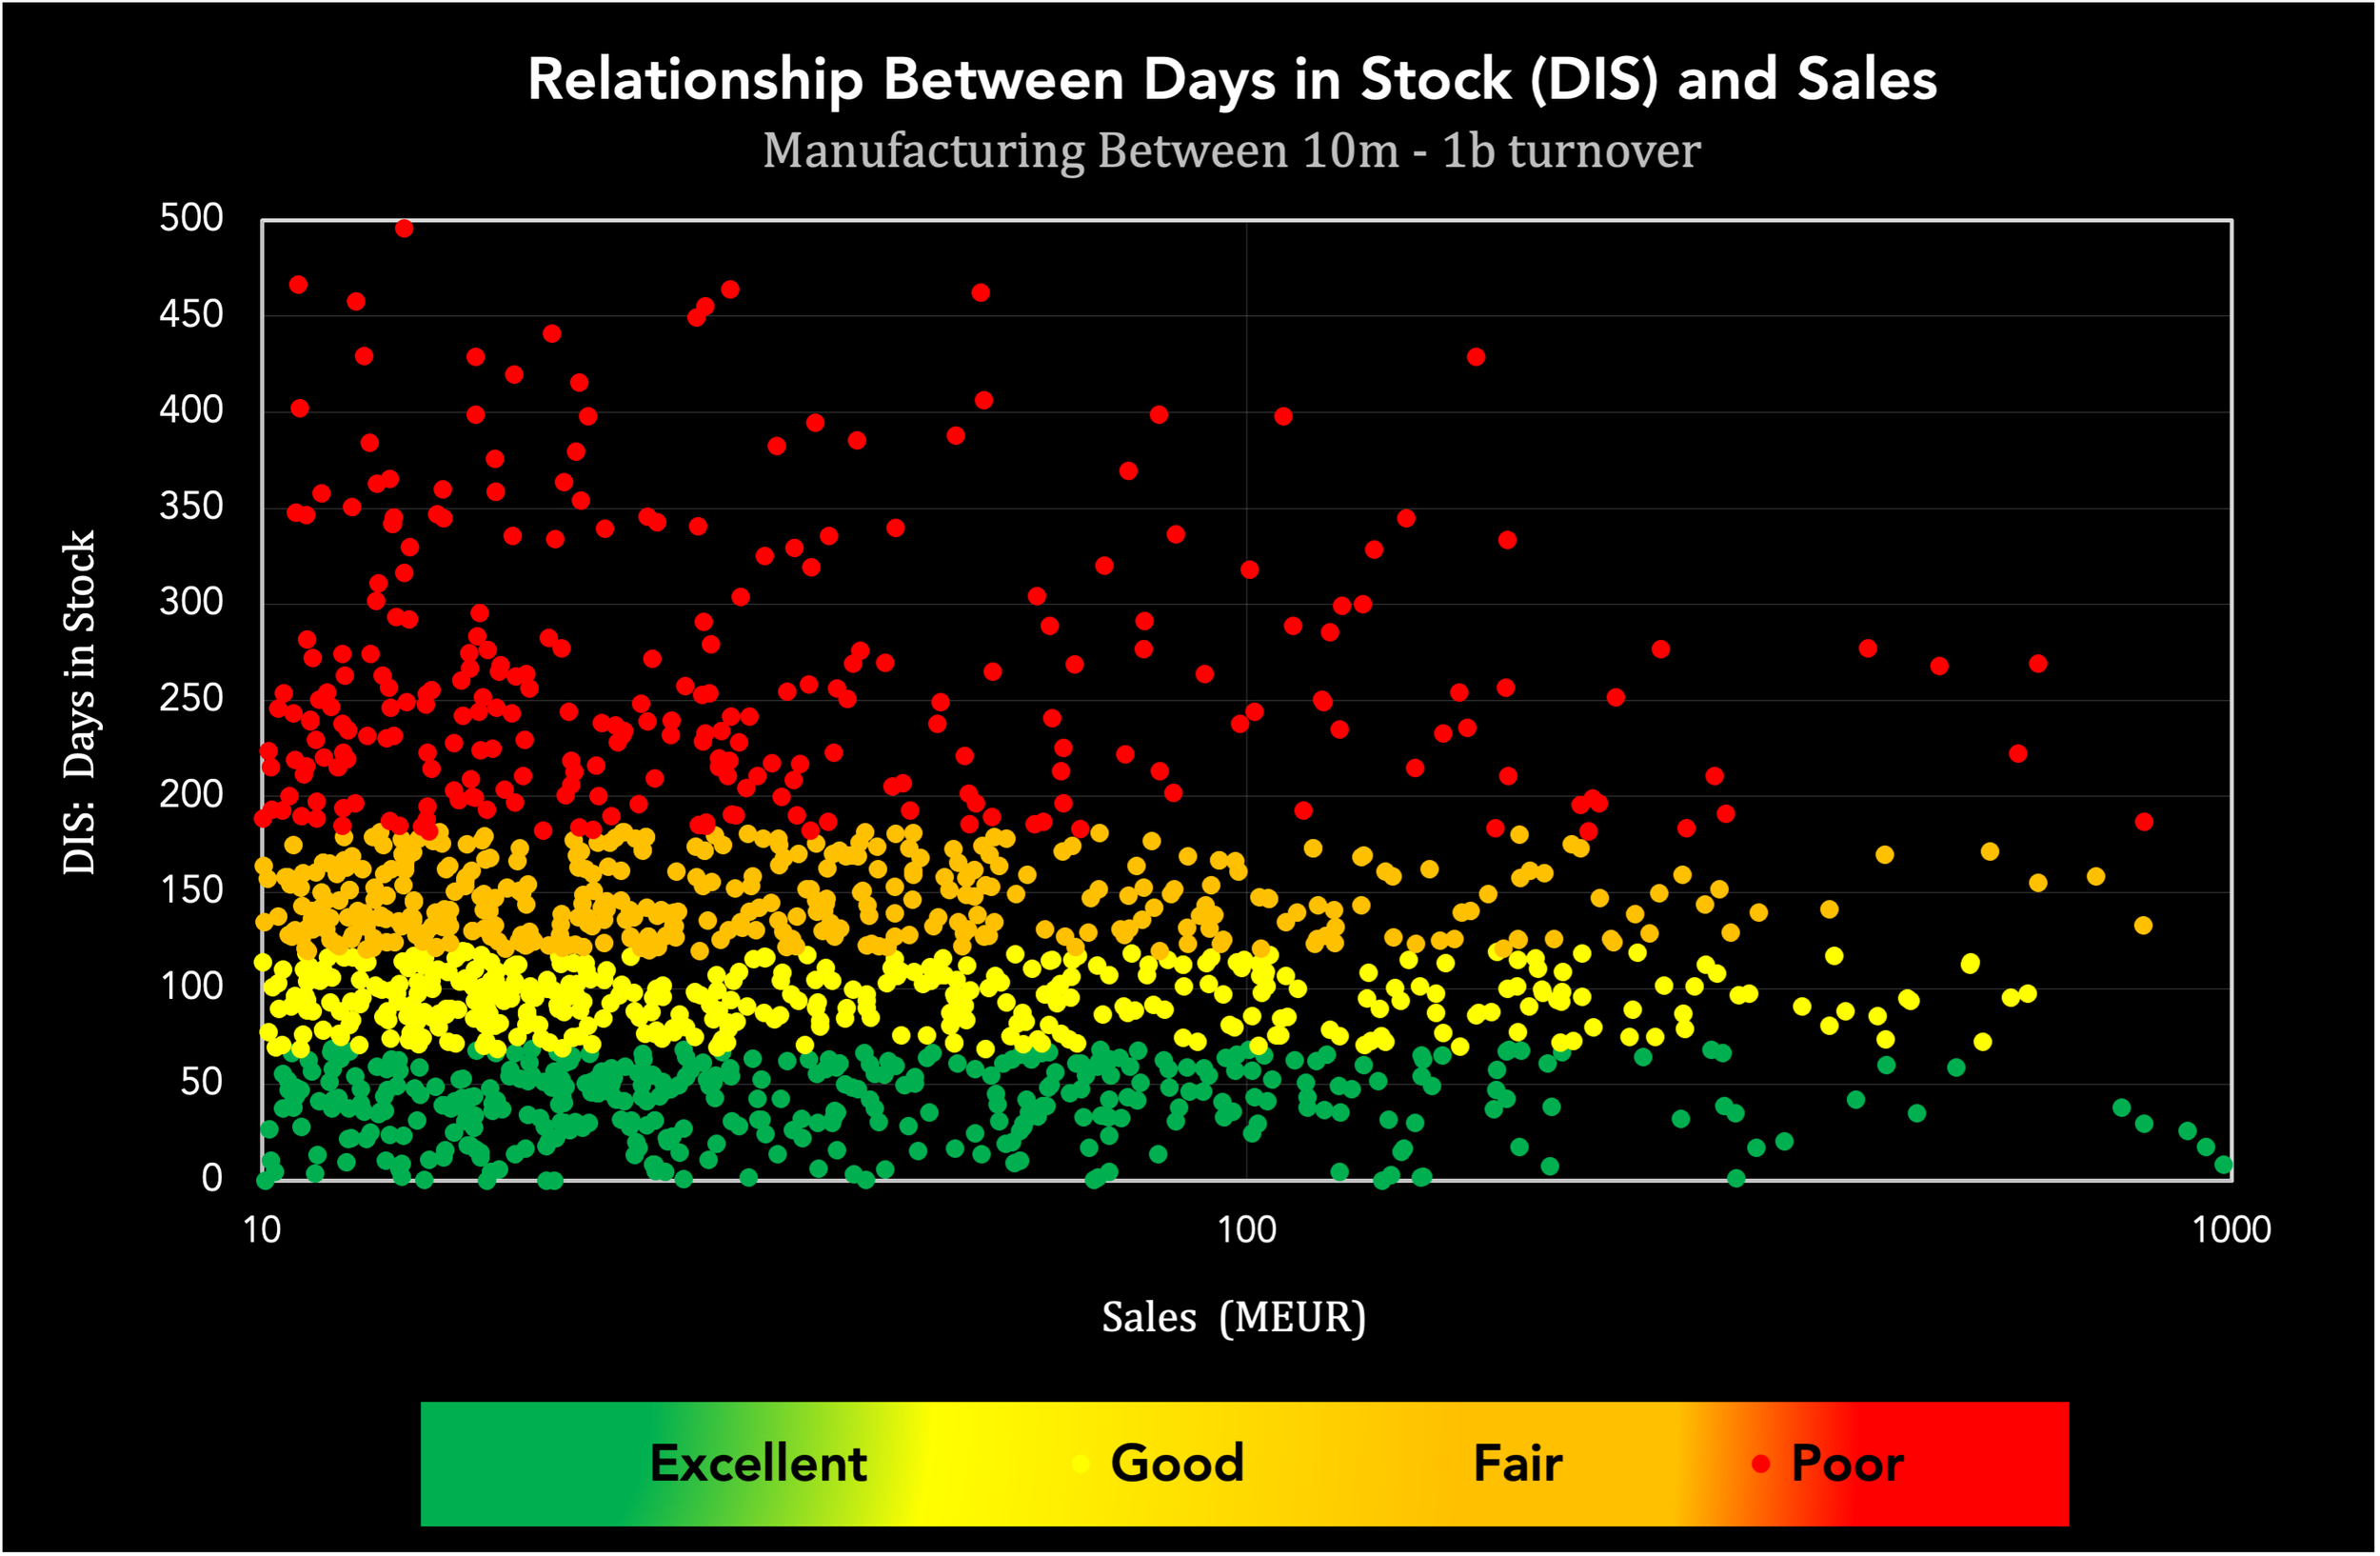
Days In Stock - DIS: How much capital is locked in inventory?
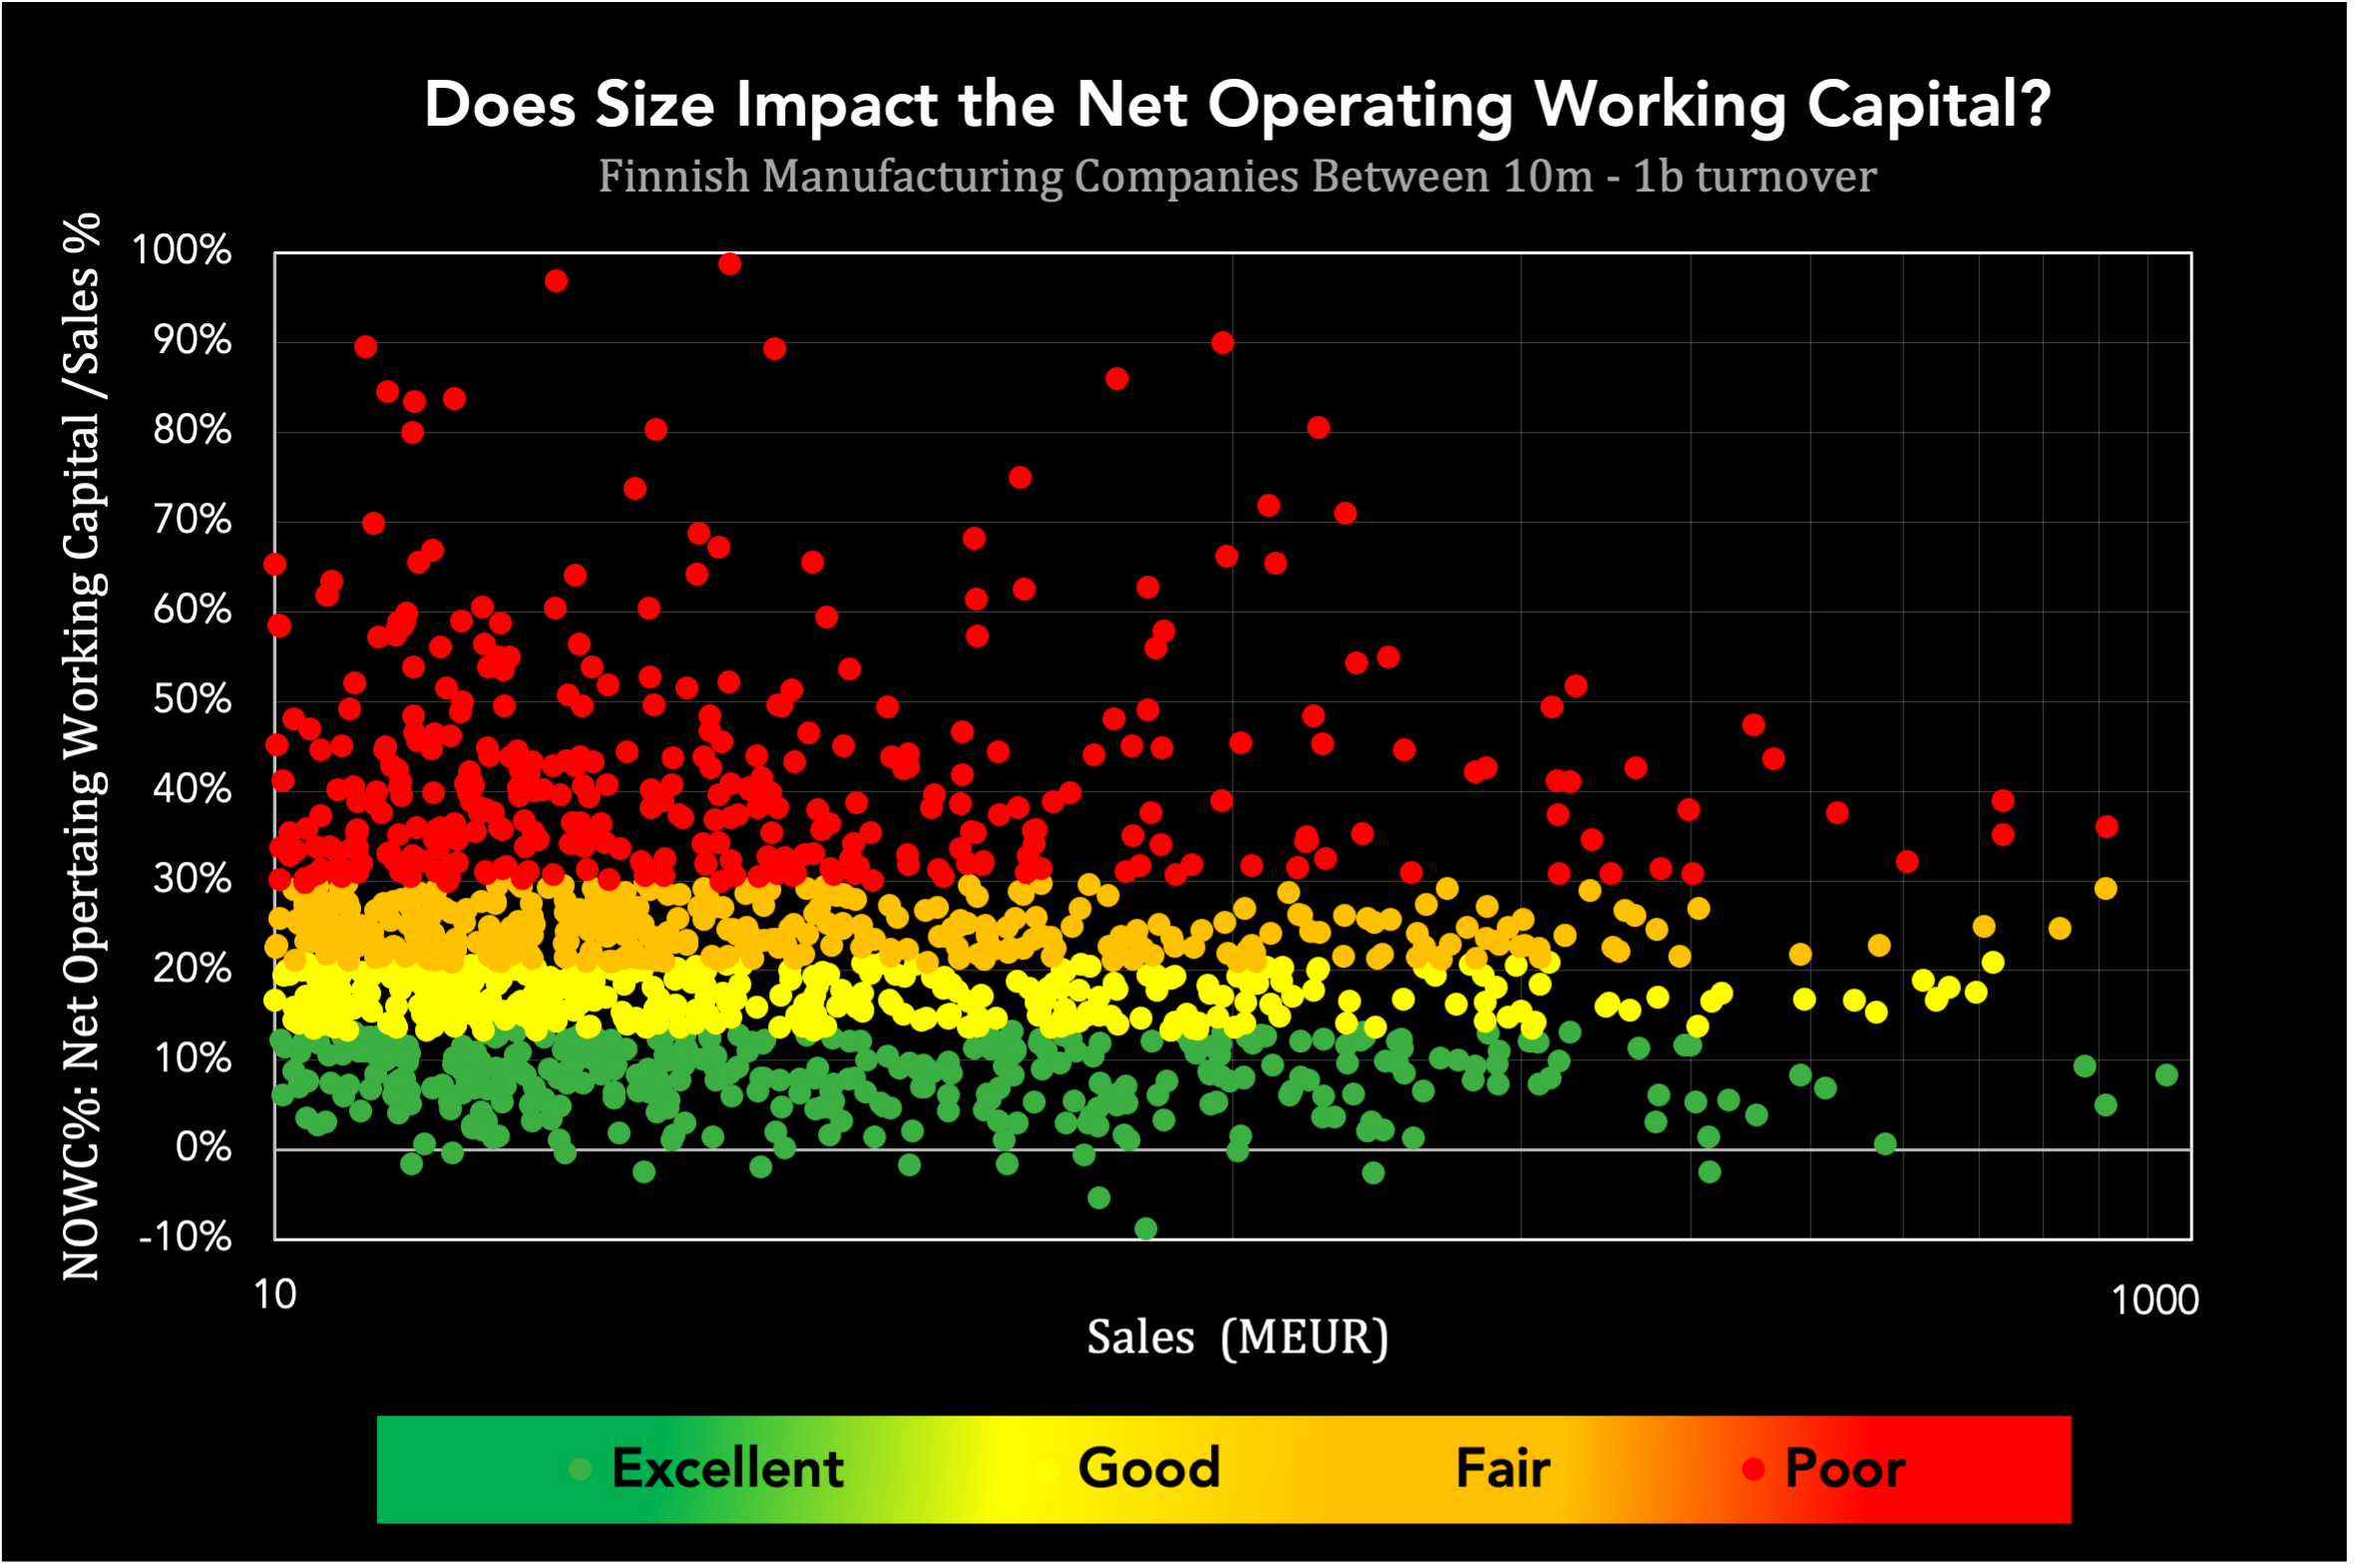
Net Operating Working Capital - NOWC: What’s the net working capital burden vs. sales?
Each company is plotted against its peers within the same industry. You’ll instantly know if your performance is healthy or dangerous.
Our sample data of the manufacturing sector
We have also analyzed the Services and Wholesale industries, and identified your company’s performance compared to those!
Insights – Manufacturing sector
1751 companies analyzed. DSO averages 55-65 days, but top quartile firms collect in 25-35 days - a 40-day gap that can unlock substantial cash. DPO for high performers is closer to 75-90 days, while many lagging firms pay suppliers within 30 days.
DIS shows the most variation - some firms hold over 250 days of inventory, while top quartile performers stay under 60.
Net Operating Working Capital (NOWC) as a percentage of sales ranges from under 10% (top quartile) to over 40% (bottom quartile).
Insight: Companies that manage receivables, extend payables responsibly, and run lean inventories have stronger cash flow and higher reinvestment capacity. Those in the red quartile risk liquidity crises. We can identify where your company stands in these KPI:s - just contact us and find out!
Where Do You Stand?
Use our visual benchmarking tools to see where your company ranks in your sector:
Are you in the green zone, or is your cash flow on red alert?
What can you do to move to a better quartile?
Interpretation Support
We don’t just give you data - we help you interpret it:
What’s normal for your industry size?
How does the growth stage affect working capital?
What should your payment policy look like?
How CapAid Helps You Take Action
We help you:
Reduce DSO with stronger payment terms and collections
Extend DPO without harming supplier relationships
Optimize DIO through inventory analysis and forecasting
Lower NOWC by freeing up trapped cash
We also align your practices with Finnish regulations and EU directives, protecting you from future legal and liquidity risks.
All data used in our visualizations are based on CapAid’s proprietary database of Finnish companies between €10M–€1B in turnover.